Rabu, 25 Agustus 2010

NASA/NOAA Study Finds El Niños are Growing Stronger

Deviations from normal sea surface temperatures (left) and sea surface heights (right)


Deviations from normal sea surface temperatures (left) and sea surface heights (right) at the peak of the 2009-2010 central Pacific El Niño, as measured by NOAA polar orbiting satellites and NASA's Jason-1 spacecraft, respectively. The warmest temperatures and highest sea levels were located in the central equatorial Pacific. Image credit: NASA/JPL-NOAA 


A relatively new type of El Niño, which has its warmest waters in the central-equatorial Pacific Ocean, rather than in the eastern-equatorial Pacific, is becoming more common and progressively stronger, according to a new study by NASA and NOAA. The research may improve our understanding of the relationship between El Niños and climate change, and has potentially significant implications for long-term weather forecasting.

Lead author Tong Lee of NASA's Jet Propulsion Laboratory, Pasadena, Calif., and Michael McPhaden of NOAA's Pacific Marine Environmental Laboratory, Seattle, measured changes in El Niño intensity since 1982. They analyzed NOAA satellite observations of sea surface temperature, checked against and blended with directly-measured ocean temperature data. The strength of each El Niño was gauged by how much its sea surface temperatures deviated from the average. They found the intensity of El Niños in the central Pacific has nearly doubled, with the most intense event occurring in 2009-10.

The scientists say the stronger El Niños help explain a steady rise in central Pacific sea surface temperatures observed over the past few decades in previous studies-a trend attributed by some to the effects of global warming. While Lee and McPhaden observed a rise in sea surface temperatures during El Niño years, no significant temperature increases were seen in years when ocean conditions were neutral, or when El Niño's cool water counterpart, La Niña, was present.

"Our study concludes the long-term warming trend seen in the central Pacific is primarily due to more intense El Niños, rather than a general rise of background temperatures," said Lee.

"These results suggest climate change may already be affecting El Niño by shifting the center of action from the eastern to the central Pacific," said McPhaden. "El Niño's impact on global weather patterns is different if ocean warming occurs primarily in the central Pacific, instead of the eastern Pacific.

"If the trend we observe continues," McPhaden added, "it could throw a monkey wrench into long-range weather forecasting, which is largely based on our understanding of El Niños from the latter half of the 20th century."

El Niño, Spanish for "the little boy," is the oceanic component of a climate pattern called the El Niño-Southern Oscillation, which appears in the tropical Pacific Ocean on average every three to five years. The most dominant year-to-year fluctuating pattern in Earth's climate system, El Niños have a powerful impact on the ocean and atmosphere, as well as important socioeconomic consequences. They can influence global weather patterns and the occurrence and frequency of hurricanes, droughts and floods; and can even raise or lower global temperatures by as much as 0.2 degrees Celsius (0.4 degrees Fahrenheit).

During a "classic" El Niño episode, the normally strong easterly trade winds in the tropical eastern Pacific weaken. That weakening suppresses the normal upward movement of cold subsurface waters and allows warm surface water from the central Pacific to shift toward the Americas. In these situations, unusually warm surface water occupies much of the tropical Pacific, with the maximum ocean warming remaining in the eastern-equatorial Pacific.

Since the early 1990s, however, scientists have noted a new type of El Niño that has been occurring with greater frequency. Known variously as "central-Pacific El Niño," "warm-pool El Niño," "dateline El Niño" or "El Niño Modoki" (Japanese for "similar but different"), the maximum ocean warming from such El Niños is found in the central-equatorial, rather than eastern, Pacific. Such central Pacific El Niño events were observed in 1991-92, 1994-95, 2002-03, 2004-05 and 2009-10. A recent study found many climate models predict such events will become much more frequent under projected global warming scenarios.

Lee said further research is needed to evaluate the impacts of these increasingly intense El Niños and determine why these changes are occurring. "It is important to know if the increasing intensity and frequency of these central Pacific El Niños are due to natural variations in climate or to climate change caused by human-produced greenhouse gas emissions," he said.

Results of the study were published recently in Geophysical Research Letters.

For more information on El Niño, visit: http://sealevel.jpl.nasa.gov/.

JPL is managed for NASA by the California Institute of Technology in Pasadena.
Alan Buis 818-354-0474
Jet Propulsion Laboratory, Pasadena, Calif.
Alan.buis@jpl.nasa.gov

Jana Goldman 301-734-1123
National Oceanic and Atmospheric Administration, Silver Spring, Md.
Jana.goldman@noaa.gov 


Kamis, 19 Agustus 2010

Drought Drives Decade-Long Decline in Plant Growth

http://www.nasa.gov/images/content/476530main_nppanomaly.jpg 


Earth has done an ecological about-face: Global plant productivity that once flourished under warming temperatures and a lengthened growing season is now on the decline, struck by the stress of drought.

NASA-funded researchers Maosheng Zhao and Steven Running, of the University of Montana in Missoula, discovered the global shift during an analysis of NASA satellite data. Compared with a six-percent increase spanning two earlier decades, the recent ten-year decline is slight -- just one percent. The shift, however, could impact food security, biofuels, and the global carbon cycle.

"We see this as a bit of a surprise, and potentially significant on a policy level because previous interpretations suggested that global warming might actually help plant growth around the world," Running said.

"These results are extraordinarily significant because they show that the global net effect of climatic warming on the productivity of terrestrial vegetation need not be positive -- as was documented for the 1980’s and 1990’s," said Diane Wickland, of NASA Headquarters and manager of NASA's Terrestrial Ecology research program.

Conventional wisdom based on previous research held that land plant productivity was on the rise. A 2003 paper in Science led by then University of Montana scientist Ramakrishna Nemani (now at NASA Ames Research Center, Moffett Field, Calif.) showed that global terrestrial plant productivity increased as much as six percent between 1982 and 1999. That's because for nearly two decades, temperature, solar radiation and water availability -- influenced by climate change -- were favorable for growth.

Setting out to update that analysis, Zhao and Running expected to see similar results as global average temperatures have continued to climb. Instead, they found that the impact of regional drought overwhelmed the positive influence of a longer growing season, driving down global plant productivity between 2000 and 2009. The team published their findings Aug. 20 in Science.

"This is a pretty serious warning that warmer temperatures are not going to endlessly improve plant growth," Running said.

The discovery comes from an analysis of plant productivity data from the Moderate Resolution Imaging Spectroradiometer (MODIS) on NASA's Terra satellite, combined with growing season climate variables including temperature, solar radiation and water. The plant and climate data are factored into an algorithm that describes constraints on plant growth at different geographical locations.

For example, growth is generally limited in high latitudes by temperature and in deserts by water. But regional limitations can very in their degree of impact on growth throughout the growing season.

Zhao and Running's analysis showed that since 2000, high-latitude northern hemisphere ecosystems have continued to benefit from warmer temperatures and a longer growing season. But that effect was offset by warming-associated drought that limited growth in the southern hemisphere, resulting in a net global loss of land productivity.

"This past decade’s net decline in terrestrial productivity illustrates that a complex interplay between temperature, rainfall, cloudiness, and carbon dioxide, probably in combination with other factors such as nutrients and land management, will determine future patterns and trends in productivity," Wickland said.

http://www.nasa.gov/topics/earth/features/plant-decline.html

New Computer Model Advances Climate Change Research

Simulation of Earth's climate.


 Community Earth System Model to be used in next IPCC assessment

This simulation, produced by the CCSM, provides new knowledge about Earth's climate.

Scientists can now study climate change in far more detail with powerful new computer software released by the National Center for Atmospheric Research (NCAR) in Boulder, Colo.

The Community Earth System Model will be one of the primary climate models used for the next assessment by the Intergovernmental Panel on Climate Change (IPCC).

The CESM is the latest in a series of NCAR-based global models developed over the last 30 years. The models are jointly supported by the U.S. Department of Energy (DOE) and the National Science Foundation (NSF), which is NCAR's sponsor.

Scientists and engineers at NCAR, DOE laboratories, and several universities developed the CESM.
"The Community Earth System Model is yet another step toward representing improved physics and biogeochemistry in a coupled model," says Anjuli Bamzai, program director in NSF's Division of Atmospheric and Geospace Sciences, which funds NCAR.

"As our understanding of climate-relevant processes improves, it is imperative to represent these processes in the model."

The new model's advanced capabilities will help scientists shed new light on some of the critical mysteries of global warming, including:
  • What impact will warming temperatures have on the massive ice sheets in Greenland and Antarctica?
  • How will patterns in the ocean and atmosphere affect regional climate in coming decades?
  • What will be the likely interaction of climate change and tropical cyclones, including hurricanes?
  • How will tiny airborne particles, known as aerosols, affect clouds and temperatures?
The CESM is one of about a dozen climate models worldwide that can be used to simulate the many components of Earth's climate system, including the oceans, atmosphere, sea ice, and land cover.
The CESM and its predecessors are unique among these models in that they were developed by a broad community of scientists. The model is freely available to researchers worldwide.

"With the Community Earth System Model, we can pursue scientific questions that we could not address previously," says NCAR scientist James Hurrell, chair of the scientific steering committee that developed the model.

"Thanks to its improved physics and expanded biogeochemistry, it gives us a better representation of the real world."

Climate scientists rely on computer models to better understand Earth's climate system because they cannot conduct large-scale experiments on the atmosphere itself.

Climate models, like weather models, rely on a three-dimensional mesh that reaches high into the atmosphere and into the oceans.

At regularly spaced intervals, or grid points, the models use laws of physics to compute atmospheric and environmental variables, simulating the exchanges among gases, particles, and energy across the atmosphere.
Because climate models cover far longer periods than weather models, they cannot include as much detail. Thus, climate projections appear on regional to global scales rather than local scales.

This approach enables researchers to simulate global climate over years, decades, or millennia. To verify a model's accuracy, scientists typically simulate past conditions and then compare the model results to actual observations.

The CESM builds on the Community Climate System Model, which NCAR scientists and collaborators have regularly updated since first developing it more than a decade ago.

The new model enables scientists to gain a broader picture of Earth's climate system by incorporating more influences.

Using the CESM, researchers can now simulate the interaction of marine ecosystems with greenhouse gases; the climatic influence of ozone, dust, and other atmospheric chemicals; the cycling of carbon through the atmosphere, oceans, and land surfaces; and the influence of greenhouse gases on the upper atmosphere.

In addition, an entirely new representation of atmospheric processes in CESM will allow researchers to pursue a much wider variety of applications, including studies of air quality and biogeochemical feedback mechanisms.

Scientists have begun using both the CESM and the Community Climate System Model for an ambitious set of climate experiments to be featured in the next IPCC assessment reports, scheduled for release during 2013-14.

Most of the simulations in support of that assessment are scheduled to be completed and publicly released beginning in late 2010, so that the broader research community can complete its analyses in time for inclusion in the assessment.

The new IPCC report will include information on regional climate change in coming decades.
Using the CESM, Hurrell and other scientists hope to learn more about ocean-atmosphere patterns such as the North Atlantic Oscillation and the Pacific Decadal Oscillation, which affect sea surface temperatures as well as atmospheric conditions.

Such knowledge, Hurrell says, can eventually lead to forecasts spanning several years of potential weather impacts, such as a particular region facing a high probability of drought, or another region likely facing several years of cold and wet conditions.

"Decision makers in diverse arenas need to know the extent to which the climate events they see are the product of natural variability, and hence can be expected to reverse at some point, or are the result of potentially irreversible, human-influenced climate change. CESM will be a major tool to address such questions."

-NSF-
Media Contacts Cheryl Dybas, NSF (703) 292-7734 cdybas@nsf.gov
David Hosansky, NCAR (303) 497-8611 hosansky@ucar.edu


The National Science Foundation (NSF) is an independent federal agency that supports fundamental research and education across all fields of science and engineering. In fiscal year (FY) 2010, its budget is about $6.9 billion. NSF funds reach all 50 states through grants to nearly 2,000 universities and institutions. Each year, NSF receives over 45,000 competitive requests for funding, and makes over 11,500 new funding awards. NSF also awards over $400 million in professional and service contracts yearly. 

 Get News Updates by Email 
Useful NSF Web Sites:
NSF Home Page: http://www.nsf.gov
NSF News: http://www.nsf.gov/news/
For the News Media: http://www.nsf.gov/news/newsroom.jsp
Science and Engineering Statistics: http://www.nsf.gov/statistics/
Awards Searches: http://www.nsf.gov/awardsearch/

Indonesia Butuh Peta Mikrozonasi Untuk Manajemen Bencana


Indonesia sudah melansir peta gempa Indonesia yang baru beberapa waktu lalu. Peta ini akan sangat bermanfaat dalam manajemen bencana di Indonesia terkait dengan hazard gempa tektonik.


Namun peta itu tidak akan banyak membantu mengetahui risiko akibat gempa bila tidak diikuti dengan pembuatan peta mikrozonasi pada daerah-daerah rawan gempa. Sekedar info saja, belum satupun kota-kota di Indonesia yang memiliki peta mikrozonasi.

Apa manfaat peta mikrozonasi dengan skala 200 meter? Ketua Tim Revisi Peta Gempa Indonesia Masyhur Irsyam yang juga Guru Besar FT Sipil dan Lingkungan ITB menyatakan bahwa dengan peta ini akan lebih mudah mengetahui bangunan mana yang kuat atau tidak terhadap gempa.


Ini dikarenakan bahwa setiap daerah memiliki karakter yang berbeda walaupun, bisa jadi, dalam satu provinsi yang sama. Misalnya DKI Jakarta saja, daerah utara dan selatan memiliki karakteristik tersendiri tanahnya. Bagian utara lebih tebal lapisan lunaknya sedangkan bagian selatan kebalikannya. Hal ini akan berpengaruh bila terjadi gempa di DKI Jakarta maka bagian utara akan lebih “bergoyang”.
Masih menurut Pak Masyhur, Kota-kota besar di dunia yang memiliki risiko gempa telah memiliki peta mikrozonasi, sehingga mereka terdukung dalam pembuatan perencanaan kontinjensi bila gempa terjadi.


Jadi, berbeda dengan pandangan umum bahwa manajemen bencana hanya melulu membicarakan tim tanggap darurat yang berisikan mereka-mereka yang jago mendirikan tenda untuk penampungan, P3K, penyediaan air bersih dan dapur umum. Manajemen bencana memerlukan ahli GIS dan Cartography baik yang berbasis sains maupun yang bersifat partisipatif.

Peran para ahli inilah yang dibutuhkan saat ini, baik untuk membuat peta risiko dan juga peta evakuasi, dan tentunya juga untuk mendukung pembuatan Rencana Tata Ruang dan Wilayah yang berbasis pada keamanan, ketangguhan, dan berkelanjutan. Dengan peta ini akan mempermudah penentuan titik-titik penampungan, baik berupa gedung-gedung maupun ruang terbuka hijau yang disaat normal dijadikan pusat kegiatan masyarakat dan dalam kondisi darurat menjadi tempat untuk memenuhi kebutuhan darurat dan kebutuhan dasar para penyintas (survovor).

Melalui forum ini saya mengajak kawan-kawan yang memiliki keahlian pada bidang GIS, P-GIS maupun pemetaan untuk menyumbangkan ilmunya untuk diamalkan pada ladang amal manajemen bencana untuk menyelamatkan kehidupan. Mari ! Kita mulai Δ

sumber : http://petapartisipatif.wordpress.com/2010/08/19/indonesia-butuh-peta-mikrozonasi-untuk-manajemen-bencana/

Rabu, 18 Agustus 2010

PROP JAMBI MEMILIKI POTENSI BESAR DALAM SKEMA REED


Konsultasi Publik Skema Redd di Masyarakat Penyangga TNBD

(Oleh Syamsul Bahri, SE. Conservationist, pengajar di STIE-SAK Kerinci)
 
Propinsi Jambi sebagai sebuah Propinsi yang memiliki hutan yang cukup luas dari berbagaui status seperti Kawasan Hutan Produksi, Kawasan Hutan Lindung, Kawasan Hutan Pelestarian Alam, jika kita pedomani Rencana Tata Ruang Wilayah Propinsi Jambi memiliki hutan seluas 2.179.440 Ha atau 42,73 % dari luas Propinsi Jambi 5.100.000 Ha, yang terbagi dalam 2 (satu) pemerintah kota dan 9 (sembilan) kabupaten. 
 
Luas kawasan hutan berdasarkan SK Gubernur Jambi Nomor : 108 Tahun 1999, dengan berbagai tipe vegetasi yang lengkap dan berbagai pengelompokan hutan, yang menyebar di bagian timur dataran rendah dengan hutan mangrove, bagian tengah hutan tropika dataran rendah dan bagian baratnya hutan tropika dataran tinggi atau pegunungan.
 
Bahkan Propinsi Jambi memiliki 4 Taman Nasional yaitu TN Kerinci Seblat, TN Bukit Dua Belas, TN Berbak, TN Bukit Tigapuluh, yang menjadi kebanggaan nasional dan Internasional serta merupakan aset bagi Pemerintah Prop jambi sebagai penyangga kehidupan yang memberikan subsidi ekologi berdimensi ekonomi bagi masyarakat Jambi.
 
Saat ini kondisi hutan tersebut tengah mengalami keterancamanan dari deforestasi dan degradasi hutan, secara global kegiatan deforestasi dan degradasi hutan menyumbang sekitar 18% terhadap emisi gas rumah kaca (green house Gases/GHGs) global. Sesuai data 18% kontribusi emisi tersebut, 75% di antaranya berasal dari deforestasi di negara berkembang, yang diperkirakan jika tidak ada upaya pencegahan akan mengalami peningkatan yang menimbulkan dampak langsung ke patani Petani antara lain kebingungan menghadapi iklim yang kian sulit diprediksi, kerawanan pangan dan dampak negatif lainnya terhadap kehidupan mahluk di planet bumi, sehingga Sub Sektor kehutanan di Indonesia dianggap sebagai salah satu penyumbang emisi yang cukup besar terhadap emisi gas rumah kaca, yang menempatkan Indonesia sebagai negara penghasil emisi terbesar ke-3 di dunia. Kondisi tersebut menyebabkan Indonesia salah satu negara dihadapkan pada tekanan agar bisa mengurangi laju emisi di negaranya. 
 
Indonesia sebagai sebuah negara berada dalam tatanan global, memiliki komitmen yang tertuang dalam pernyataan ”Presiden SBY membuat komitmen untuk untuk menurunkan emisi sebesar 26 persen” dan sebagian besar berasal dari sector kehutanan, melalui intervensi kebijakan kebijakan (policy approaches and positive incentives) yang memungkinkan Indonesia mengurangi deforestasi dengan tetap menjamin keberlanjutan pembangunan nasionalnya.
 
Secara global kondisi pemanasan global harus diminimalkan melalui komitmen negara-negara baik negara maju dan negara berkembang, sehingga melalui Pertemuan Conferencee of the Parties 13 (COP-13) di Bali tahun 2007 menghasilkan keputusan tentang skema pengurangan emisi dari deforestasi dan degradasi (REDD) di negara berkembang. Melalui skema REDD, negara maju akan memberikan insentif kepada negara berkembang yang berhasil melestarikan hutan mereka. Sehingga hutan tersebut nantinya dapat digunakan sebagai daerah penyerapan karbon. 
 
Sosialisasi Skema Redd in Developing Countries (Reducing Emissions from Deforestation and Degradation in Developing Countries) atau Pengurangan Emisi dari Deforestasi dan Degradasi di Negara Berkembang, merupakan salah satu langkah yang terbagi atas 3 tahap: tahap persiapan, readiness phase, dan full implementation. Saat ini Indonesia sudah berada dalam tahap readiness phase (2009-2010). Termasuk di dalamnya tahap sosialisasi dan konsultasi publik tentang REDDI Readiness Activities lagi gencar-gencarnya dilakukan baik oleh Pemerinrtah, LSM dll
 
REDD adalah mekanisme internasional untuk memberikan insentif yang bersifat positif bagi negara berkembang yang berhasil mengurangi emisi dari deforestasi dan degradasi hutan, yang merupakan salah satu kegiatan mitigasi perubahan iklim di sektor kehutanan, dan bersifat sukarela (voluntary) serta menghormati kedaulatan negara (sovereignty).
 
Mekanisme perdagangan karbon di sektor kehutanan dalam rangka mitigasi perubahan iklim dibawah UNFCCC/Kyoto Protocol yang melibatkan negara berkembang sampai saat ini baru terbatas pada A/R CDM (peningkatan kapasitas penyerapan/penyimpanan carbon melalui kegiatan tanam menanam). Sedangkan REDD baru dalam tahap persiapanpelaksanaan pilot percobaan/demonstration activities dan dalam proses penyiapan perangkat hukum pelaksanaan REDD
 
Sepakat atau tidak sepakat, sudah semestinya Indonesia dapat meminimalkan kerusakan hutan yang antara lain dapat dilakukan melalui pengurangan deforestasi dan degradasi hutan, melaui skema REDD yang merupakan mekanisme internasional dapat mendukung upaya Indonesia dalam mencapai tujuan reformasi yang telah/sedang dilakukan di sektor kehutanan, baik melalui aliran dana, peningkatan kapasitas, maupun transfer teknologi.
 
Upaya tersebut memerlukan biaya yang di luar kemampuan dana domestik kebanyakan negara berkembang, yang opportunity costs (biaya untuk kompensasi bagi pemilik hutan atas nilai kegiatan yang paling menguntungkan), implementation costs (biaya yang diperlukan untuk perbaikan perencanaan dan pengelolaan), administrative costs (biaya operasional), dan transaction costs (biaya untuk penggalangan dana, negosiasi dengan partner, monitoring, approval), pendanaan tersebut baik melalui mekanisme.
 
Untuk sosialisasi Skema Redd tersebut melalui Konsultasi publik di Wilayah Taman Nasional Bukit Duabelas dilaksanakan oleh KK Warsi Jambi, di 2 Kecamatan sekitar Taman Nasional di Kantor Camat Air Hitam di Desa Jernih Kabupaten Sarolangun, pada tanggal 2 Juni 2010, dan di Kantor Camat Marosebo Ulu Kabupaten Batang Hari pada tanggal 8 Juni 2010, yang diikuti oleh tokoh masyarakat, pemuda, perangkat desa dll, konsultasi Publik tersebut dikaitkan dengan pengelolaan Taman Nasional Bukit Duabelas, pemberdayaan masyarakat di wilayah penyangga dan pengelolaan Hutan Desa.
 

Izin Kerap Langgar Tata Ruang

Lagi-lagi Badan Pelayanan Perizinan Terpadu (BPPT) Pemkot Semarang dipersoalkan. Sebagai lembaga yang mengeluarkan izin, dinilai terlalu mudah memberikan legislasi usaha tertentu. Seringkali izin tersebut tidak sepadan dengan aturan lain, terutama dari sisi tata ruang.


Wakil Ketua Komisi A mengatakan pihaknya mempersoalkan persetujuan izin prinsip. Karena itu pihaknya akan mengiventarisasi izin-izin yang tidak sesuai dengan tata ruang. Beberapa contoh kasus kerap terjadi, ironisnya pihak-pihak yang bersangkutan telah mengantongi izin prinsip. Demikian berita yang dimuat Suara Merdeka, 28 Juli 2010.

Menurut sepengetahuan kami, proses perizinan yang lazim sesuai dengan ketentuan yang berlaku bagi setiap usaha adalah: Pertama pemohon harus mengajukan izin lokasi, kemudian izin mendirikan bangunan (IMB) dan izin undang-undang gangguan (HO) serta izin lainnya.

Yang dimaksud izin lokasi adalah izin yang diberikan kepada badan usaha, bisa badan hukum atau bukan badan hukum, perorangan, untuk mendapatkan tanah untuk usahanya yang sesuai dengan Rencana Tata Ruang Wilayah  (RTRW). Salah satu syarat untuk mendapatkan izin lokasi adalah persetujuan prinsip dari instansi teknis atau pihak yang berkompeten dengan rencana kegiatan itu.

Izin prinsip yang dimaksud tujuannya untuk mengetahui bonafiditas perusahaan, tidak  terjadi spekulasi tanah, kegiatan tersebut sesuai dengan daftar skala prioritas ekonomi di wilayah tersebut. Dalam persetujuan izin prinsip lokasi tempat usaha belum ditetapkan sampai dengan letak tepat (detail), hanya menyebut wilayah administrasi (kabupaten atau kota).

Dalam pemberian izin lokasi tujuannya agar lokasi tempat usaha yang akan digunakan sesuai dengan rencana dan kebijakan penguasaan, pemilikan, penggunaan, dan pemanfaatan tanah atau yang disebut dengan Rencana Tata Ruang Wilayah. Disamping itu pemberian izin lokasi dimaksudkan agar pemanfaatan tanah tidak menimbulkan dampak lingkungan yang negatif.

Substansi yang diatur dalam izin lokasi adalah letak tepatnya di mana, batas-batas lokasi jelas, luasnya berapa, peruntukan tanahnya jelas, serta dicantumkan syarat-syarat yang menyangkut penguasaan, pemilikan, penggunaan dan pemanfaatan tanah.

Suatu usaha akan disetujui apabila lokasi usaha tersebut terletak sesuai dengan RTRW dan akan diberikan surat izin lokasi. Setelah pengusaha tersebut mendapat izin lokasi baru kemudian mengurus IMB, HO, serta izin lain yang diperlukan

.
Apabila lokasi usaha yang dimohon oleh pengusaha itu tidak sesuai RTRW permohonan izin lokasi tersebut ditolak (tidak disetujui). Dengan demikian izin lokasi adalah pintu pertama bagi investor atau pengusaha untuk dapat melakukan kegiatannya, setelah itu baru pengurusan izin-izin lain.

Dari penjelasan itu dapat diambil kesimpulan bahwa kalau Wakil Ketua Komisi A mempersoalkan persetujuan prinsip tidak sepadan dengan tata ruang wilayah, hal ini agak kurang tepat, karena yang menjadi pedoman kalau suatu usaha itu sesuai dengan tata ruang wilayah atau tidak adalah dari surat izin lokasi.

Izin ini menunjukkan letak tepat suatu usaha terdapat pada surat izin lokasi dengan dilampiri peta lokasi skala besar. Untuk itu kalau Komisi A akan mengevaluasi izin-izin yang telah dikeluarkan Pemkot Semarang sesuai dengan tata ruang apa tidak adalah dengan jalan mengevaluasi surat izin lokasi dengan kesesuaian RTRW Kota Semarang, bukan dengan izin prinsip.

Drs J Gembong Edy W
Jl Puspanjolo Timur X/12
RT 06 RW 02 Bojongsalaman
Semarang

***


sumber : http://suaramerdeka.com/v1/index.php/read/cetak/2010/08/18/120808/10/Izin-Kerap-Langgar-Tata-Ruang

Ketika Ilmu Pengetahuan Pulang

  Setiap pagi, sebelum matahari terbit, ada seseorang yang telah memulai pekerjaannya. Ia bukan ilmuwan. Bukan profesor. Bukan pejabat. Buka...

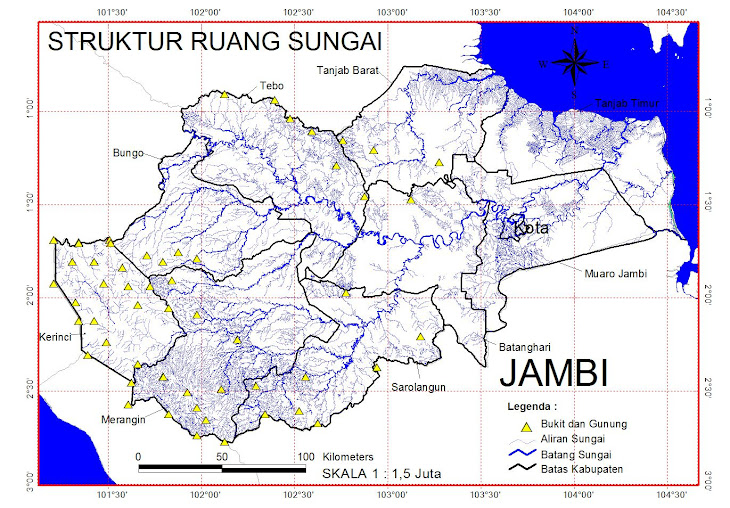
Struktur Sungai

Struktur Sungai

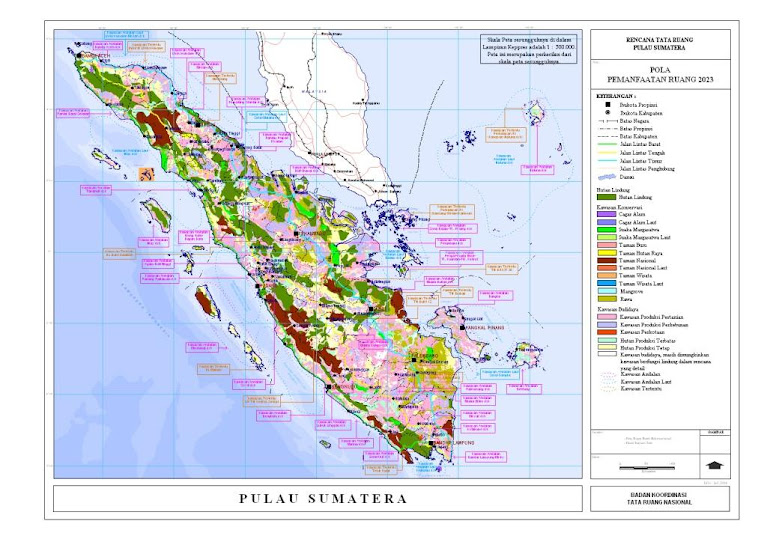
POLA RUANG SUMATERA

POLA RUANG SUMATERA

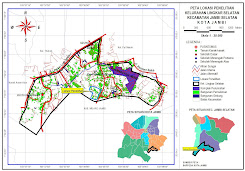
Kec. Jambi Selatan - Kota Jambi

Kec. Jambi Selatan - Kota Jambi

BERHALE ISLAND

Pulau Berhala
Large selection of World Maps at stepmap.com
StepMap Pulau Berhala


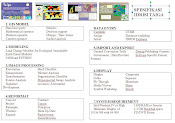
ISI IDRISI TAIGA

ISI IDRISI TAIGA

HOW TO GOIN ON BERHALE ISLAND

Kota Jambi

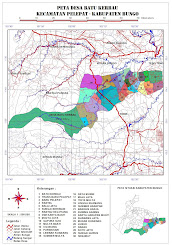
Desa Batu Kerbau - Kab. Bungo

Desa Batu Kerbau - Kab. Bungo

TERAKHIR DI UPDATE GOOGLE

COMMUNICATE

+62 812731537 01