 How to measure the level of my GIS? there is no university give graduate letter GIS to me, there not GIS training and seminars that I follow, there
is no subjects in my class to explaining about GIS, and
there are no measuring
instruments give a standard level of my GIS. In study I am
focus learn about agriculture and botany, and I am never to dream can be GIS.
At elementary school I don’t like geography study, the first blind map study
(learning knowledge place area has not name place).
I have skills use GPS and transfer GPS data using software
Arcview3.3. Sometimes I transfer GPS data use cable data and without cable
data. Some my friends for help me to make maps, but they have data with writing coordinates UTM, DMS and TM3 (projection
national agrarian department). On the other hand, spatial data in my maps like
as administration area, road network, river flow and other use geographic
projected.
Then, UTM projection data on my converted using extensions projection
utility wizard to change as geographic projection. The Projection geographic with
structure format degrees-minutes-second (DMS) converted again using Microsoft Excel. The sum converted DMS
in Excel become as structure
format like degree
coma degrees (dddd,dddd). But, for the Y coordinates or longitude coordinates
must be given a minus sign (-) because my locate project below the equator. And
when I am receive data with projection TM3, I use
Transcoord for change to UTM or dddd,dddd projection be dddd,dddd, it’s a software product survey and
mapping national departement (Indonesia).
For transfer the GPS
data using data cable, usually GPS data contained data with extention gpx then I am converted to extention
shp and kml using QuantumGIS 1.7. In managing data at Arcview3.3 I am usually
use of extensions like ; 3D Analyst, add XY, add DMS coordinates, do google
earth, graticules and measured grids, analys image, JPG image support spatial
analysis and Xtools. And how to know make a map using the information above, more details can be viewed on my Youtube
of GIS at address :
I am use google earth and put it on
my blog at
http://forumtataruang.blogspot.com
and I am use the Global Map
II to download topographic data (SRTM) too. I am use ArcGIS 9.3 but
not as good using in Arcview 3.3. On build web GIS, I can do make use
mappetizer software but use the trial only.
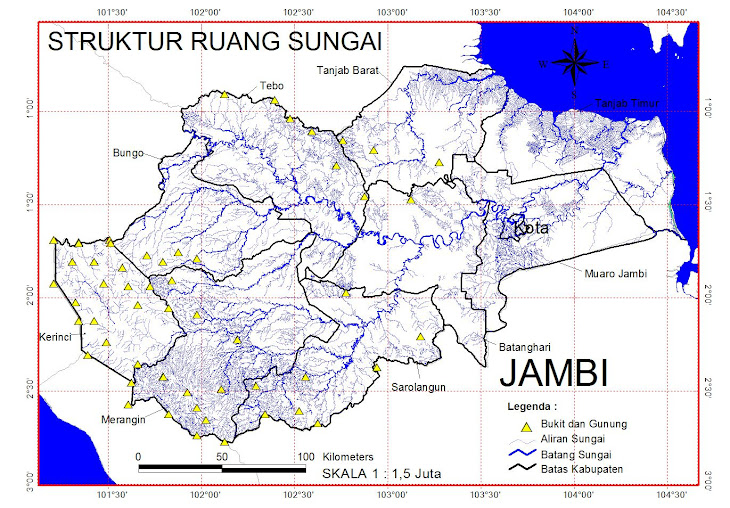
I’ve created a map city of Jambi with very details, far as I know it’s the best,
I often promote to government but no respond. GIS not familiar on government. Besides making a map the city of Jambi, I also
made a detailed map of Jambi Province.
My work flow in using GIS begin with input
data from GPS or hard copy data (scanning), after data in process into shp and then I find the right
scale to size the paper is being used. After data on scale can be adjusted and
then add the data supporting such as data administration area, road network,
river flow and spatial data information its self. Besides making maps, I am also training for
someone to making maps. Last training of using GPS mapping can be found at this web address;
Map is a complex picture, a lot of lines that overlap.
Need art in managing the composition of color and spatial information. Drawing
map do not like a kids picture, find harmony color between
spatial
data and attribute data information. This is my interest on making a layout maps. Use a
font size according place on lay out map, more attributes information to show,
I am must be more observant in arrange. The final map is display contained the value art and aesthetics. Format data in
making the map ever I am created like format *.apr, *.shp, *.kml, etc.
I
work using GIS as a free land surveyors, draftsman maps, GPS and ArcView
trainer. In training I do not require payment and sometimes I am voluntary. I
do aim for socialization of GIS, because my town live very little understand
GIS and need GIS course get expensive cost. Then I am willing to coach GIS for
free, so that GIS will easily known by public.


